Abstract
- Optimizing parameters from our previous strategy improved the simulated return and drawdown
- Adding trading fees made the strategy more realistic while finding optimal sentiment combinations and window sizes increased simulated return
- Further improvements to the methodology is adding slippage and market volume and picking window sizes randomly at each step of the process
In the previous research note, we described how to build a strategy based on Augmento Bullish and Bearish Bitcoin sentiment, and backtested it on Bitmex XBTUSD.
The signal was created by
- computing a ratio of Bullish/Bearish sentiment
- smoothing this signal by applying a 7 day MA (moving average)
- creating a second signal by applying a second 7 day MA on the smooth signal
- computing the difference between the two
This resulted in a stationary signal which we translated into a strategy with a PnL (Profit and Loss) of circa 40x over a period of two years.
In this article, using Bitcoin sentiment data from Twitter, we will discuss how to simulate live trading conditions more realistically and how we can optimize the strategy further. We will do so by adding trading fees, selecting other sentiment pairs, and testing various window size parameters.
Factoring in fees
The backtest in our previous article ignored fees which lead to overoptimistic results. In order to simulate realistic costs of trading, we assume a taker fee of 0.75% (as on Bitmex). Each time a long or a short position is executed, a fee of 0.75% of the trade is subtracted from the PnL. This is shown in the last two lines of the code below:
for i in steps:
   if s[i-1] > 0.0:
      pnl[i] = (p[i] / p[i-1]) * pnl[i-1]
   else if s[i-1] < 0.0:
      pnl[i] = (p[i-1] / p[i]) * pnl[i-1]
   else if s[i-1] = 0.0:
      pnl[i] = pnl[i-1]
   if sign(s[i-1]) != sign(s[i-2]):
      pnl[i] = pnl[i] — (pnl[i] * trade_fee)
Adding fees to a strategy changes the PnL drastically. Though the Bullish/Bearish strategy in the last article achieved a PnL of above 30, adding 0.75% fees for every trade reduced the PnL to 2.5. In the following sections, we will look at how we can optimize the parameters of the strategy to perform well, even in more realistic market conditions. That is, a) finding optimal combinations of Bitcoin sentiments and b) optimizing window sizes of the moving averages.
Finding top performing Bitcoin sentiment combinations
The Augmento API currently provides data on 93 Bitcoin sentiments and topics, equating to 8649 possible combinations of topic and sentiment pairs. There are good reasons to test them all. For example, Bearish sentiment could surge temporarily due to an expected correction, but may not indicate a long term Negative outlook. Also, combining sentiments (e.g. Negative or Optimistic) with topics (e.g. Hacks or Technology) could lead to trading signals that are able to pick up the Bitcoin community’s emotions in the context of topics that matter to them.
The goal is to find the optimal sentiment/topic pair. That’s why we ran the entire process (see the last article) from signal building to backtesting on all possible 8649 combinations of Bitcoin sentiments and topics. For this test, we kept the window size for the MAs constant at 7 days in order to create the first list of possible top performers. The outcome is a huge list of PnL.
Top Pnl sentiment pairs
topic/sentiment1       topic/sentiment2       PnL
Scaling                (De-)centralisation    2.972788
Bearish                Bullish                3.008512
Scaling                Bullish                3.095835
Scam_Fraud             Launch                 3.163351
Rebranding             Risk                   3.330282
Bearish                Positive               3.541391
Panicking              Bots                   3.624959
Bug                    Whales                 3.750890
Pessimistic_Doubtful   Whitepaper             3.813242
Whales                 FOMO_theme             3.869889
Shilling               Team                   3.869968
Leverage               ETF                    3.981470
Rebranding             Marketcap              4.003318
Bots                   Wallet                 4.348451
FUD_theme              Open_source            4.698155
Bearish                Announcements          6.329139
Open_source            Community              6.670214
Whitepaper             Bots                   14.288472
Here are the bottom pairs:
topic/sentiment1       topic/sentiment2       PnL
Investing/Trading      Bearish                0.000422
(De-)centralisation    Price                  0.000424
Positive               Selling                0.000434
Learning               Bearish                0.000571
Advice/Support         Bearish                0.000692
Euphoric/Excited       Long_term_investing    0.000718
Technical_analysis     Short_term_trading     0.000743
Problems_and_issues    Short_term_trading     0.000836
Learning               Good_news              0.000877
Euphoric/Excited       Short_term_trading     0.000885
Scam/Fraud             Token_economics        0.000941
Listing                Token_economics        0.000953
Problems_and_issues    Due_diligence          0.000978
Positive               Hopeful                0.001021
Problems_and_issues    Fearful/Concerned      0.001069
Use_case/Applications  Short_term_trading     0.001078
Prediction             Going_short            0.001093
Uncertain              Short_term_trading     0.001124
Technology             Short_term_trading     0.001135
Learning               Adoption               0.001171
Interestingly, many of the top performing pairs have “negative” connotations for topic/sentiment 1 (Pessimistic_Doubtful, Bug, Shilling, Bearish), while many topics/sentiments with “positive” connotations lie under topic/sentiment 2 (Bullish, Positive, Open_source).
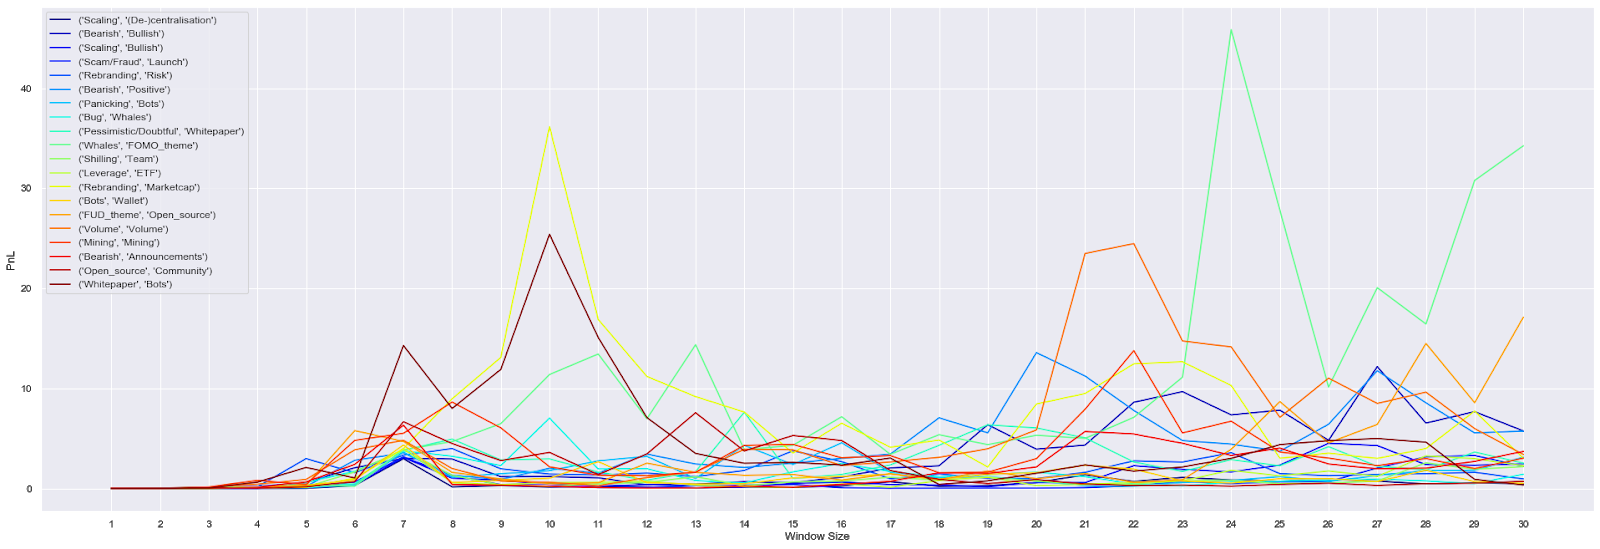
The next step in the search for the top performing pair is plotting the PnL of the selected top 20 topics/sentiments against different window sizes, where both the long and short window parameters share a value. We do this to get some idea of how each pair behaves for a range of window parameters. Here we’re looking for pairs that respond well for a wide range of parameters (wide flat lines) rather than pairs with the highest peaks since pairs that perform well across a range of parameters are more likely to be robust to changing market conditions
There is no single optimal window size for all pairs of topics but the bigger windows tend to yield a bigger PnL. The explanation might be that a longer window might be a better fit for the data, though we must be aware that larger window sizes are more likely to overfit the data.
There is not always a clear intuition between sentiment/topic pairs and PnL. For example, Whitepaper/Bots yielded the highest PnL. But there is no reason why a high ratio of mentions of Bots relative to Whitepaper should produce a signal to hold a long position. Though Bearish/Positive was not the best performing pair (giving a PnL of 3.54), it aligns best with our intuition, and so we will use this pair for further analysis of window parameters.
Optimizing the window parameters
Last time, we smoothed the sentiment data by taking an SMA for the past 7 days. Furthermore, to generate a signal for a “real” sentiment, we calculated a rolling mean of that smooth sentiment, also using a 7-day window. The choice of parameters was arbitrary. Therefore, it would be interesting to see how our strategy would have performed for other window parameter combinations.
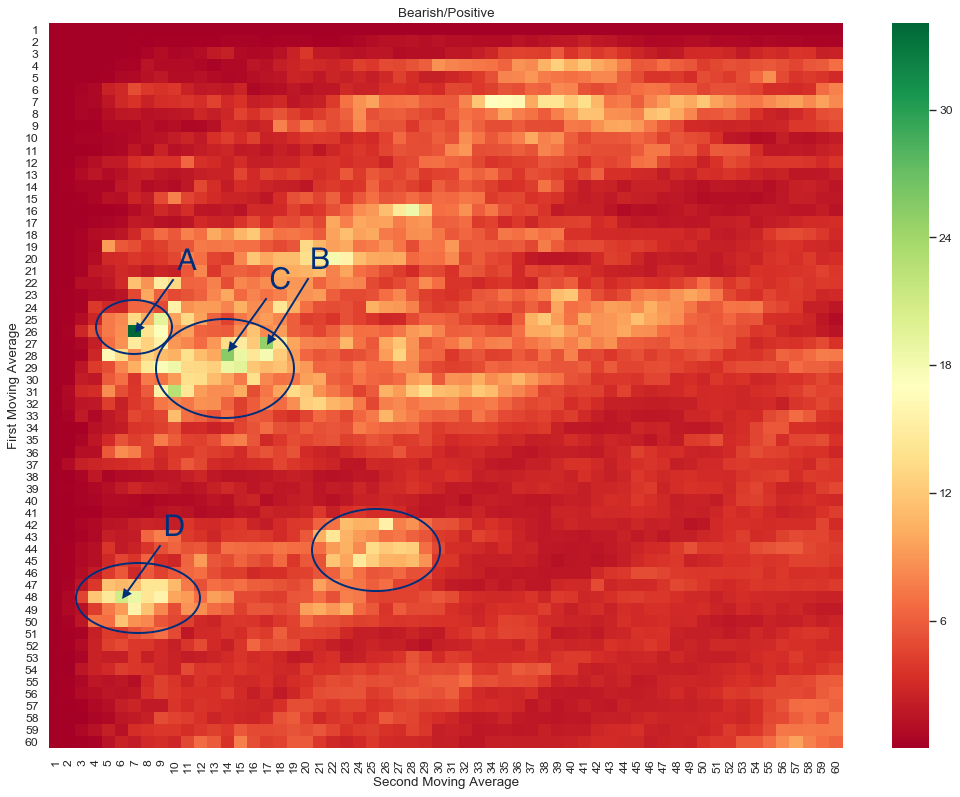
In this test, we ran the strategy above using the Bearish/Positive for all possible combinations of long and short window sizes between 1 and 60 days. The resulting PnLs are plotted on the heatmap below:
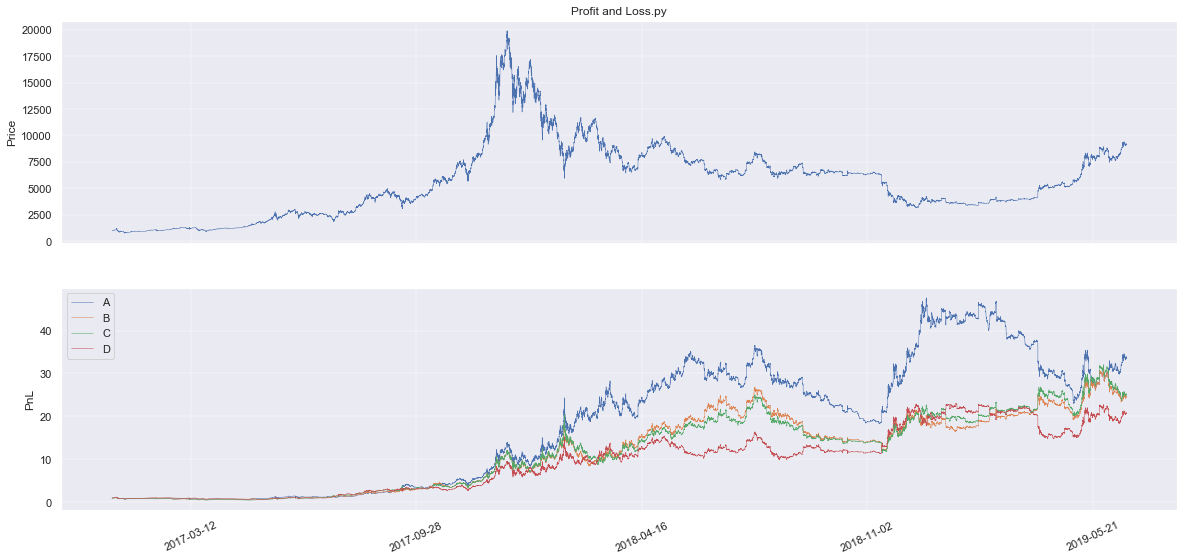
The graph gives the performance of the strategy across window parameters, with high PnLs in green, and low PnLs in red. There are some “islands” where PnL is higher than in the rest of the graph. These islands are usually located in the areas where the first moving average is longer than the second one. Since we want PnL to be similar over a range of parameter values, we want to be within areas where PnL is high but at the same time not fluctuating too much as a function of the window parameters. These areas can be seen as “stable.” A good example would be the areas circled on the graph. We also plotted the performances of the chosen points. The strategy with the highest PnL uses 26 as the first and 7 as the second parameter for the moving windows.
All four strategies perform well both in the bull market of 2017, and the bear market of 2018. Though strategy A appears to outperform B, C, and D, it also appears to be less stable, resulting in large up-swings and draw-downs. Strategy D looks significantly more stable but underperforms the other three. B and C appear to be similarly stable to D while performing slightly better. Referring back to the heat map, B and C are also in what appears to be a wider flatter area of reasonably high PnL. For this reason, we would select the parameters from C for a live strategy (28, 14), based on a resulting return of ≈24 BTC, based on a starting wallet of 1 BTC (2400%).
Python on steroids
Running 8649 backtests using NumPy and Python without any optimization takes a while, and running it for the first time would have taken 6 hours. To boost the speed, we used Numba, a JIT (Just In Time) compiler that compiles Python code into C. After implementing Numba, It took us not more than two minutes to get an array with all 8649 PnLs.
Caveats and further research
We made modifications and added fees to the backtest. Moreover, we also showed how other Augmento topics can be used to generate a strategy. Among all pairs of topics, we identified the top 20 signals that would yield a profitable strategy. Even though some of them are not easily interpretable, some provide a good intuitive interpretation. We gave an example of a signal based on Bearish/Positive Bitcoin sentiment but other interesting ones might also be Pessimistic_Doubtful/Whitepaper or Bearish/Launches, all of which yield positive and relatively high PnL while providing us a natural (easy) interpretation.
The backtest presented can still be improved. Additional features by adding slippage, market volume, among others, could make a backtest more robust. Furthermore, we can pick window sizes randomly at each step, this would show how stable our strategy is. We will consider all these topics in our next articles.
Access the complete code and the historical Augmento sentiment data here.


