
Abstract
- Based on 29 months worth of data we analyzed on which weekdays Twitter users express more positive or negative sentiments regarding Bitcoin
- Simplistic seasonality analysis of sentiment in Bitcoin markets looks promising but can be misleading
- Normalization and analysis of trends’ deviation from the mean is critical to avoid misinterpretation of patterns when employing sentiment data in trading strategies
- Alternative data can contain clear periodicity that is not found in the price alone and can be used to discover otherwise hidden market cycles
Which day is the best day to buy Bitcoin? This question pops up regularly on social media and blogs. In the stock market, the notion that returns vary depending on the weekday is reflected in ideas such as the Weekend Effect, which describes that prices for stocks fall on Mondays after a rise on the last trading day. Whether such inefficiencies exist is still up to debate.
In any case, these discussions about weekday based returns lead us to ask if such seasonality also applies to sentiment. Do people express more positive or negative sentiments towards Bitcoin on different weekdays? And if so, is that difference significant enough to signal price action?
Normalization
We used a data sample from daily Twitter sentiment data related to Bitcoin ranging from 2016-11 to 2019-03. We used relative sentiment numbers and normalized the data. This is necessary since different periods are characterized by the diverging volume of tweet activity which, if not relativized and normalized, would render a comparison across the timeline meaningless.
First of all, we created relative sentiment numbers. This is done by dividing the absolute sentiment numbers related to bitcoin by total mentions of bitcoin for a given period.
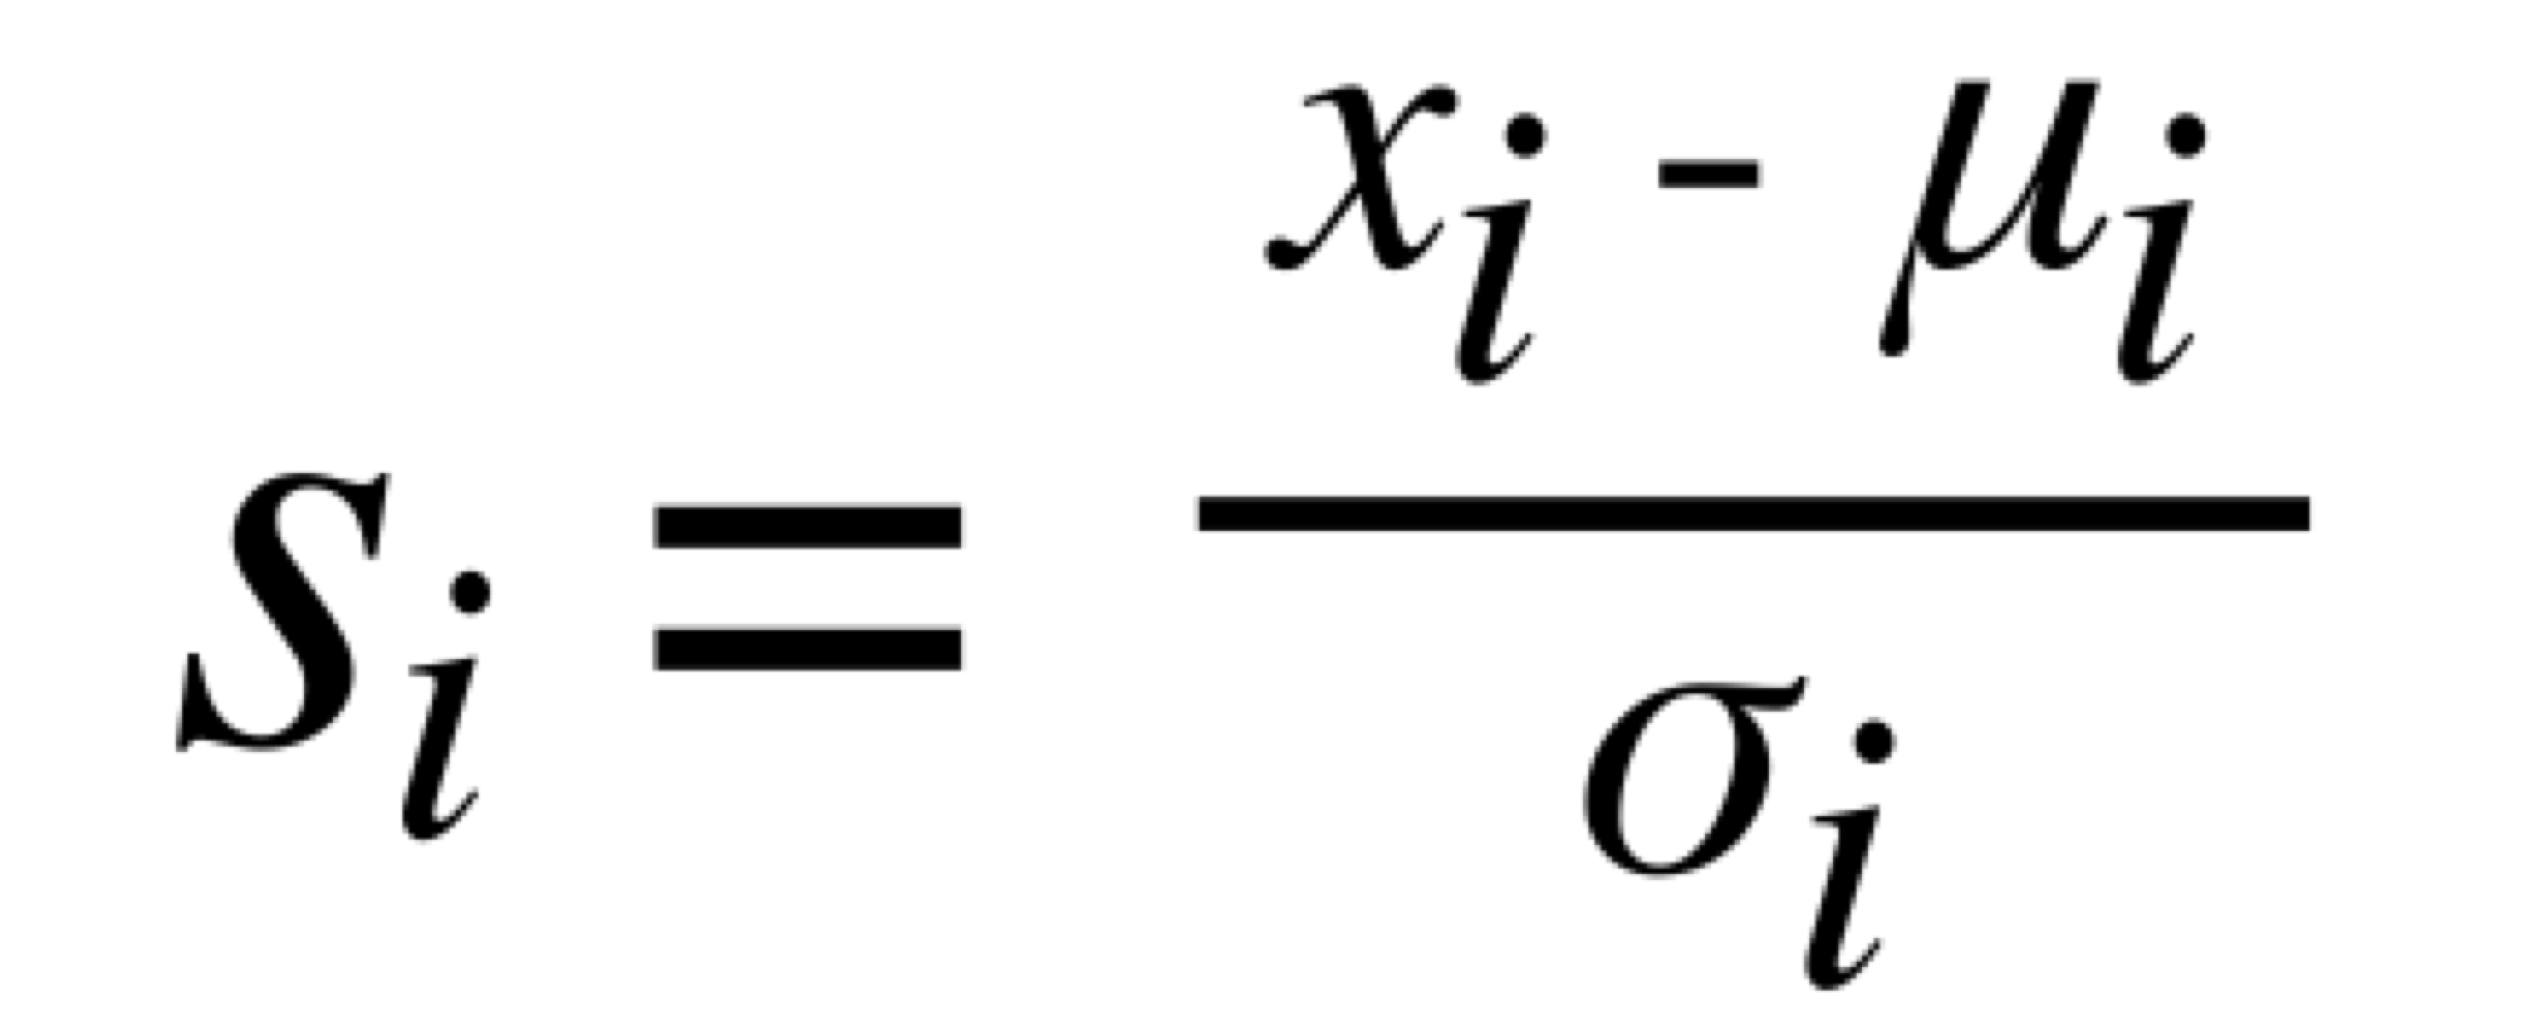
Secondly, we normalized the data by dividing the difference between the relative sentiment numbers and the weekly sentiment mean (window size of mean = 7 days) by the standard deviation of the sentiment (window size of std = 7 days).
This procedure leads to data which is agnostic to differences in Tweet volume. As an example, normalized Bearish sentiment:
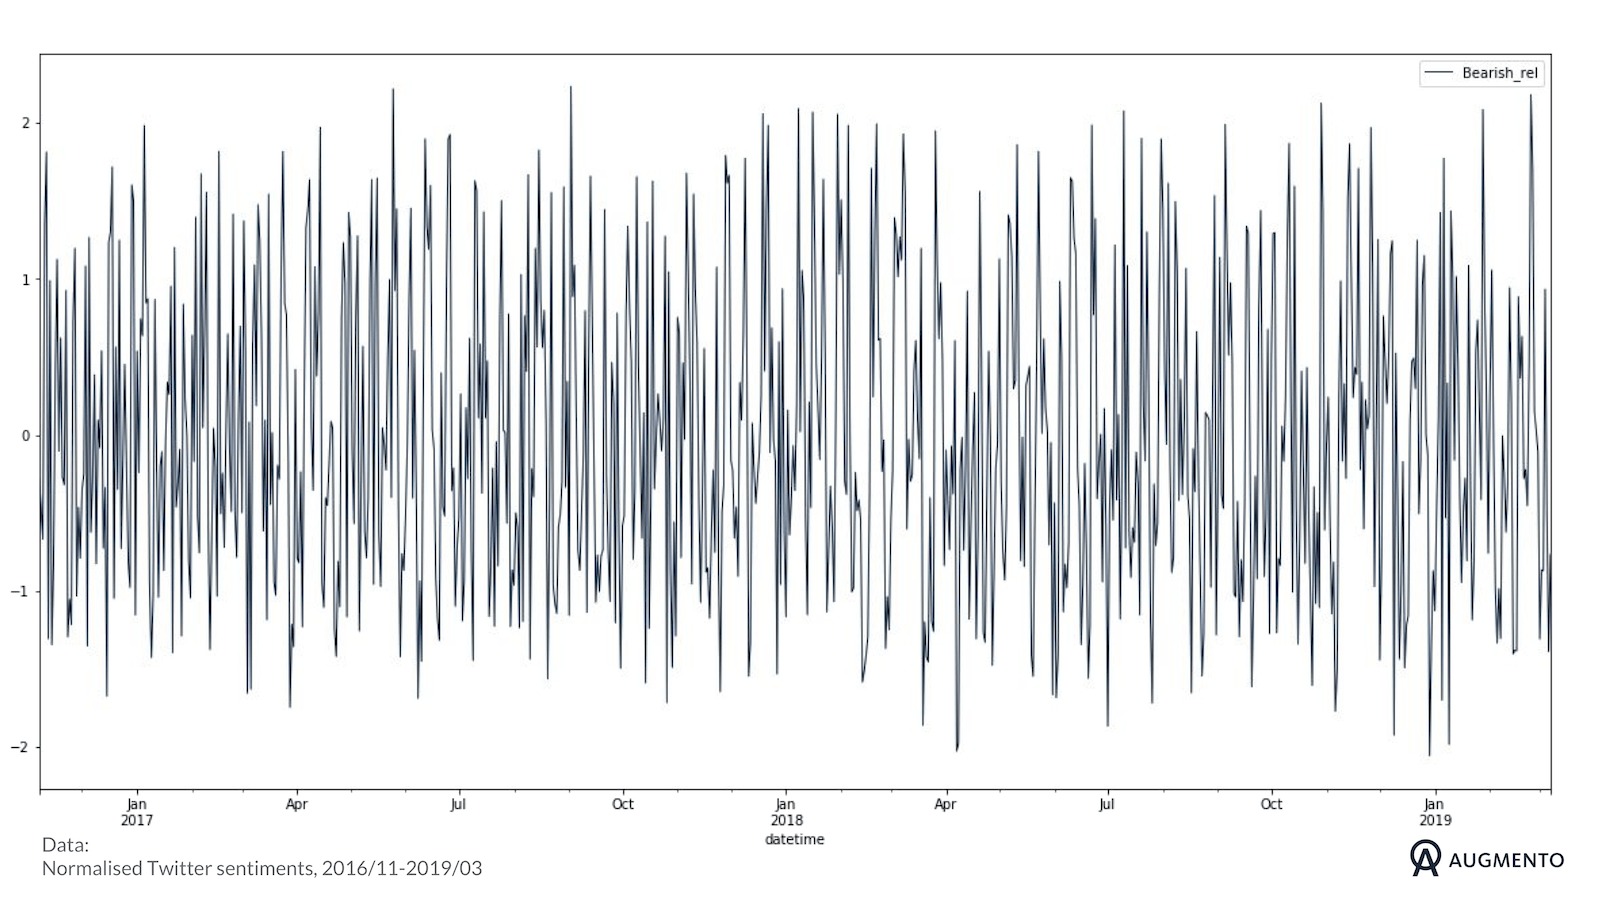
Without normalization, the curve would follow the characteristic price curve of Bitcoin to a much greater extent instead of oscillating in a more “digestible” range.
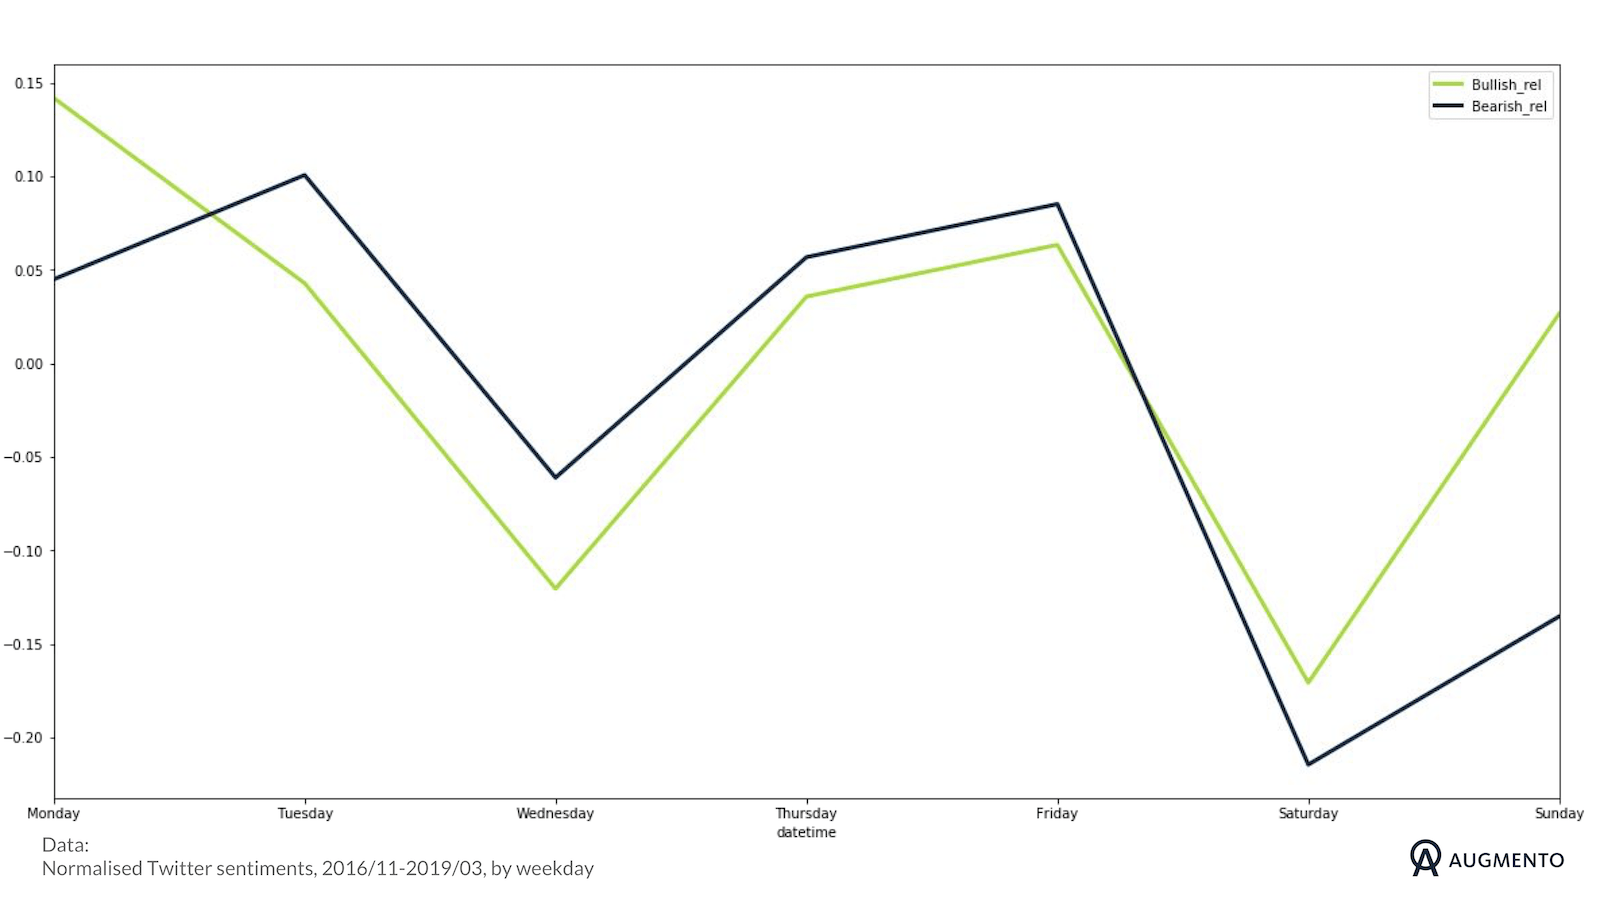
In the next step, we aggregated the data by weekdays, resulting in the average sentiment for each day of the week over the past two years.
Looks promising …
At first sight, plotting sentiments against each other looks very promising. Comparing positive and negative sentiment looks as if the positive sentiment is rising over the week with a positive peak on Friday while negative sentiment shows an extreme peak on Saturday.
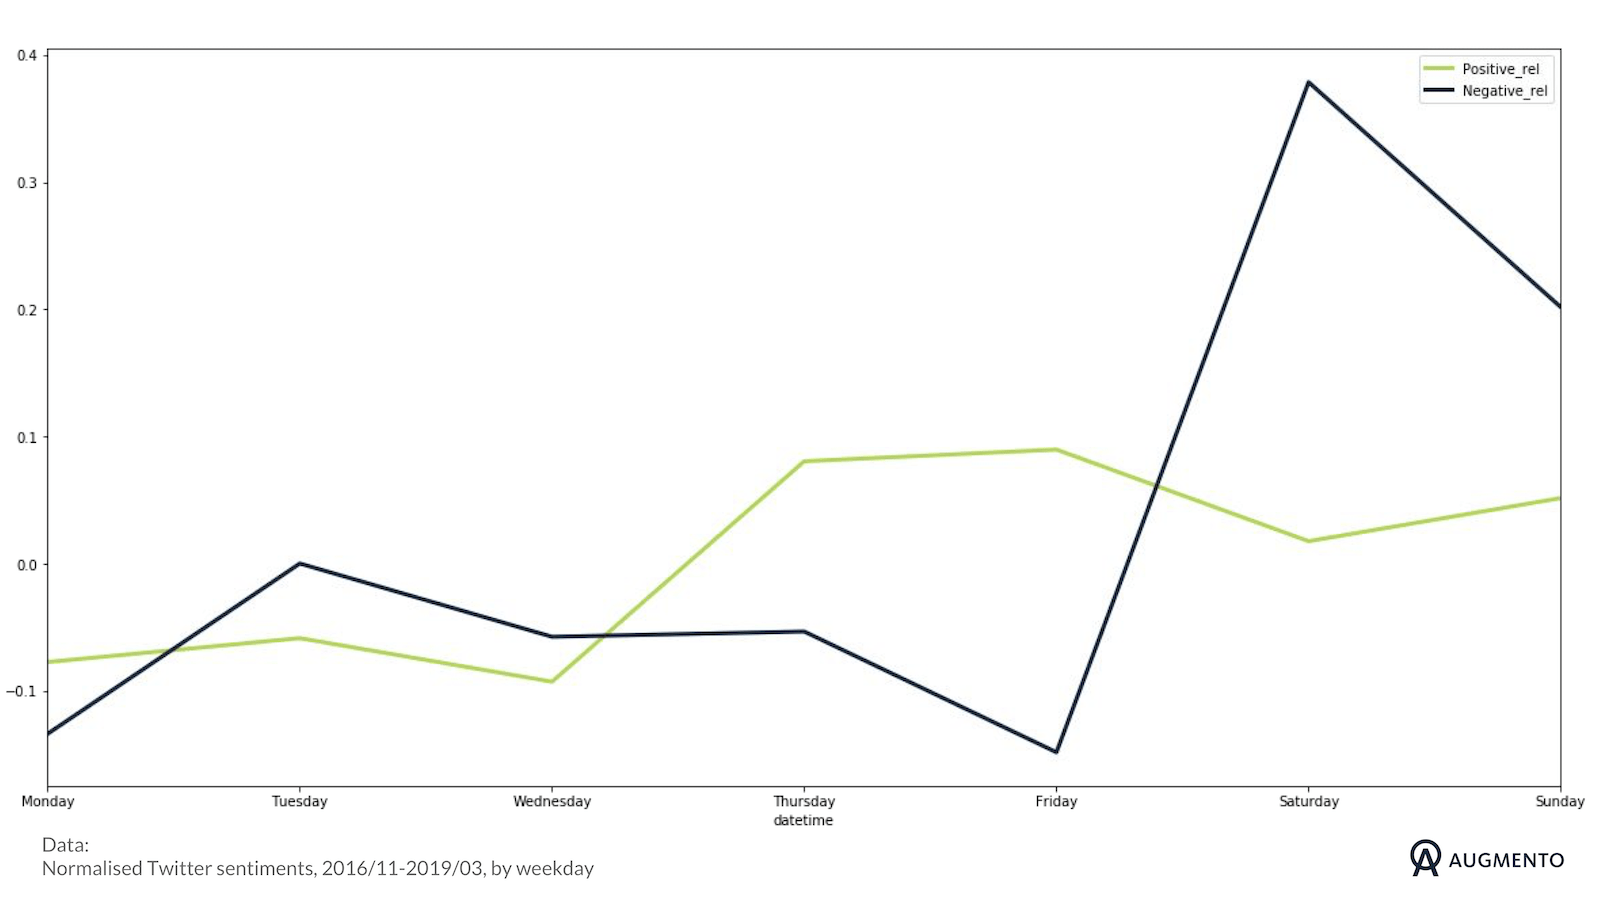
Bullish and bearish sentiments seem to follow each other throughout the week while bullish sentiment seems to dominate on the weekends.
… can be misleading.
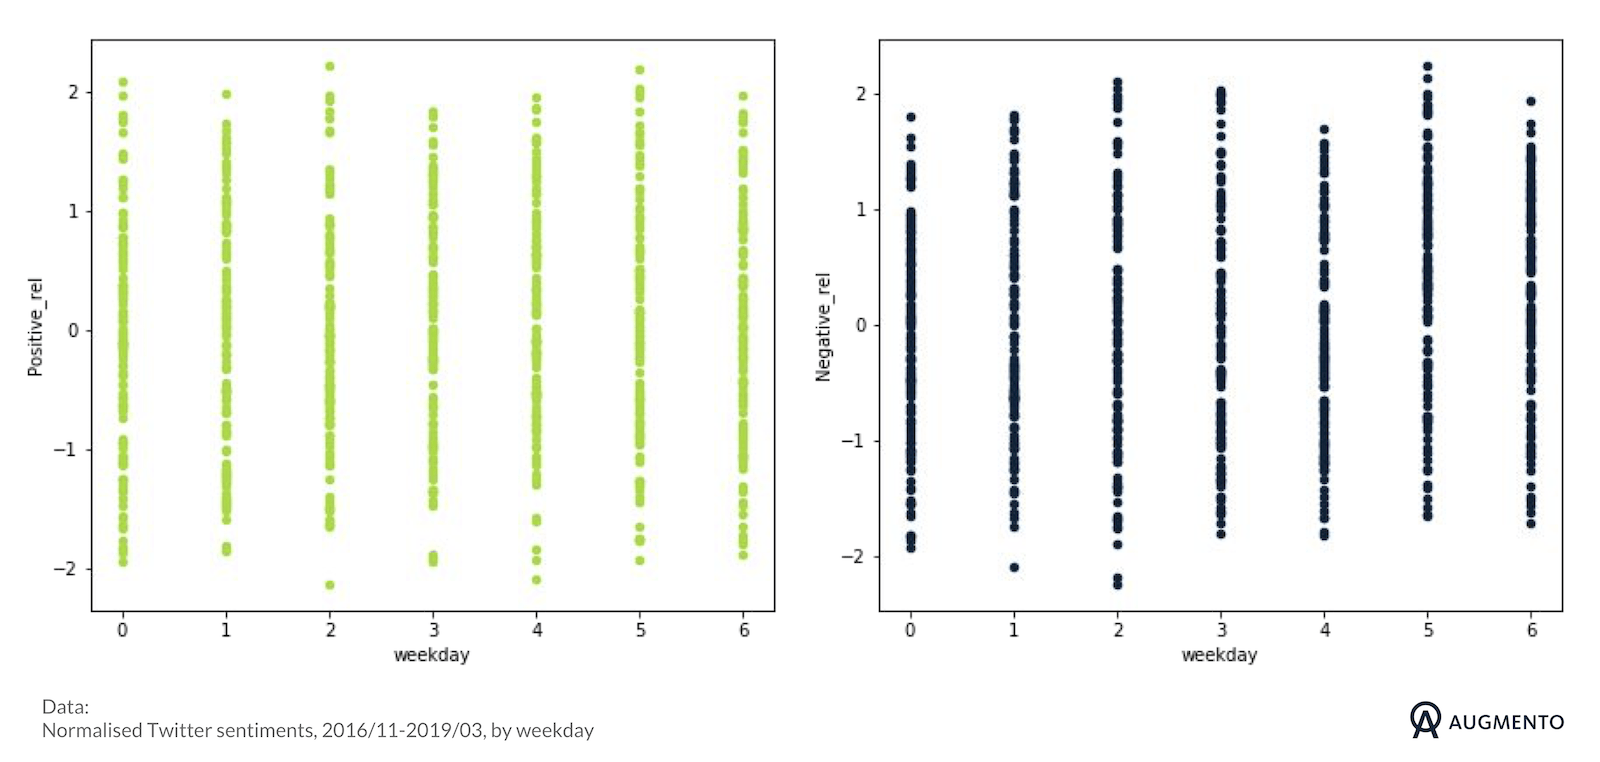
Can we regard these trends as significant? To answer this we plotted every single data point and sorted it by weekday. It shows that there are differences between days of the week. However, it also shows that the deviation of the data points from the mean of each respective day is substantial:
Implications and further work
While plotting the average normalized values of various sentiments for each day of the week gives interesting results, plotting the deviations of the data from the means shows that perceived patterns probably don’t have statistical significance. Our analysis also shows that normalization and analysis of mean deviations are critical when employing sentiment in trading contexts to avoid misinterpretation of the data.
However, this is not to discount for the method. Further work could include aggregating sentiment over shorter or longer periods (is the market more or less bullish at the end of the month?), or by geography (which country is most bearish?). Alternative data can contain strong signals and often contain clear periodicity that is not found in the price alone and can be used to discover market cycles that are otherwise hidden. Further work could also be done to understand how to leverage these cycles, and ultimately use them as a tool for generating alpha.