Abstract
- We show that building synthetic indicators based on opposing sentiments can have predictive capabilities in cryptocurrency markets
- We create indicators based on three pairs of opposing sentiments: Positive/Negative, Bullish/Bearish & Good news/Bad news
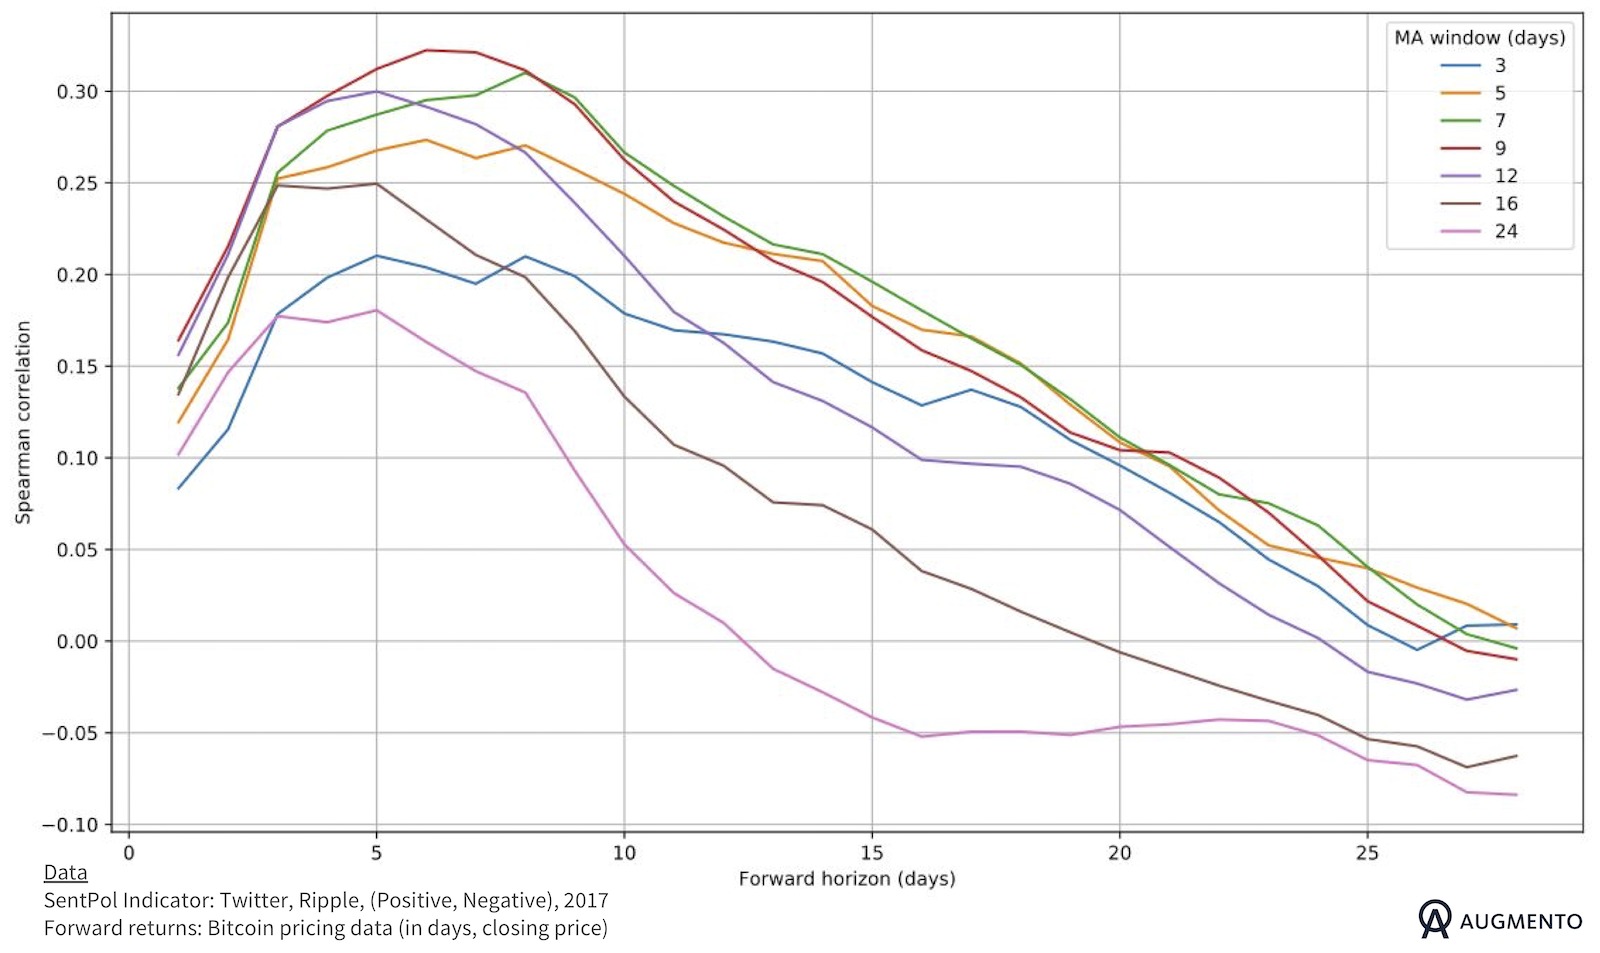
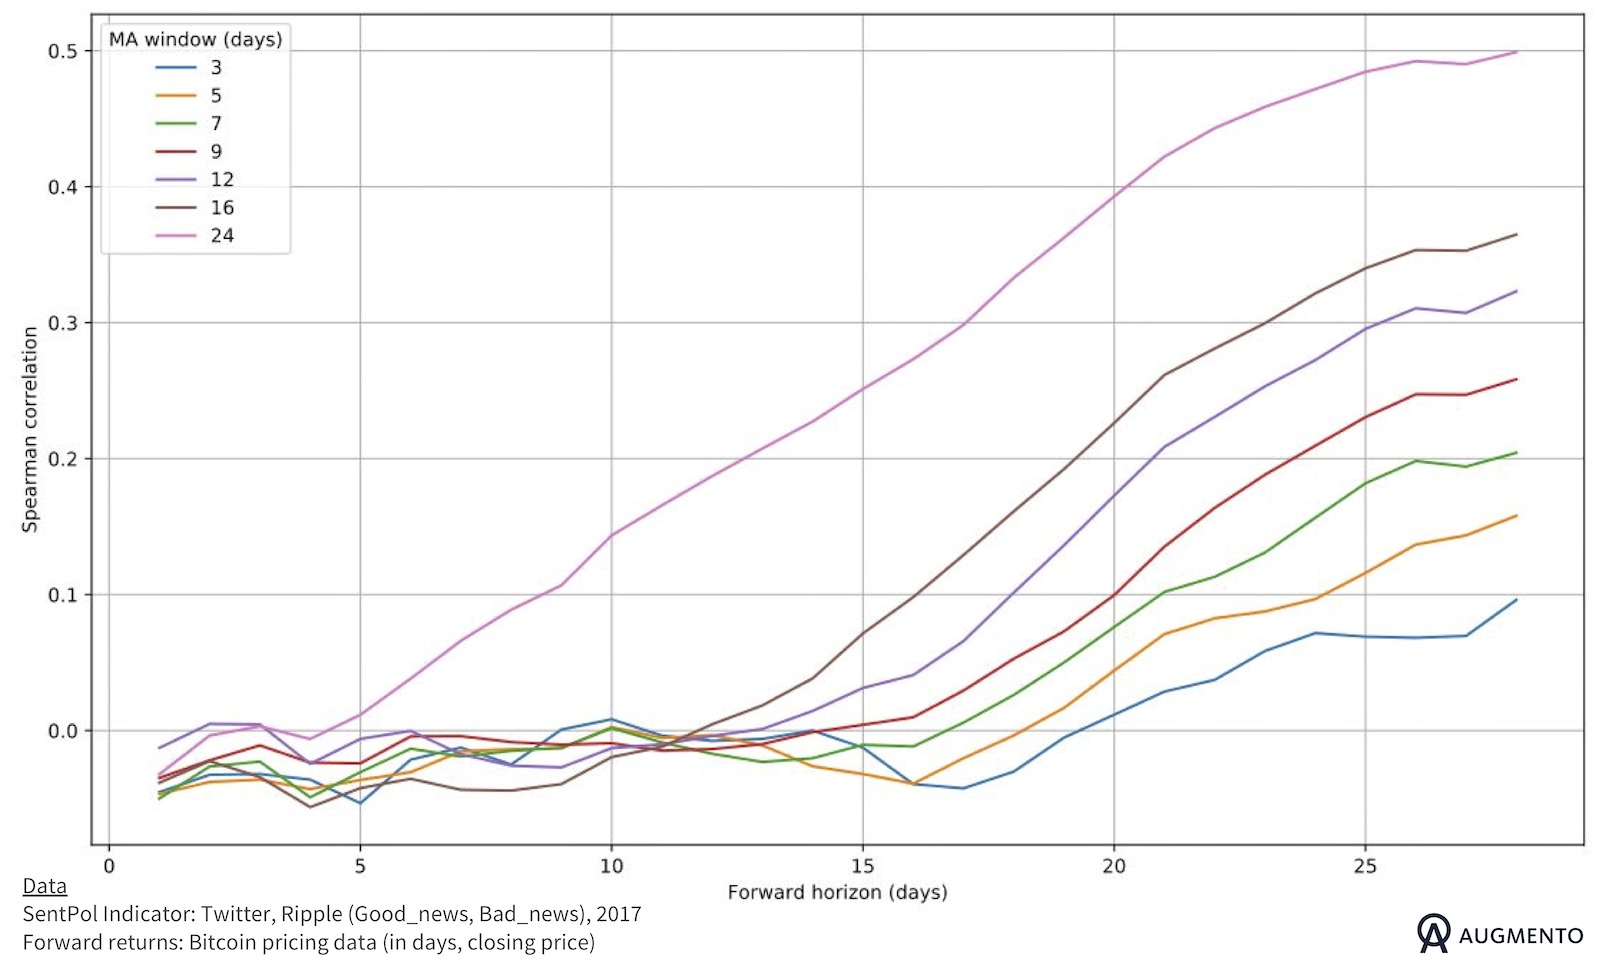
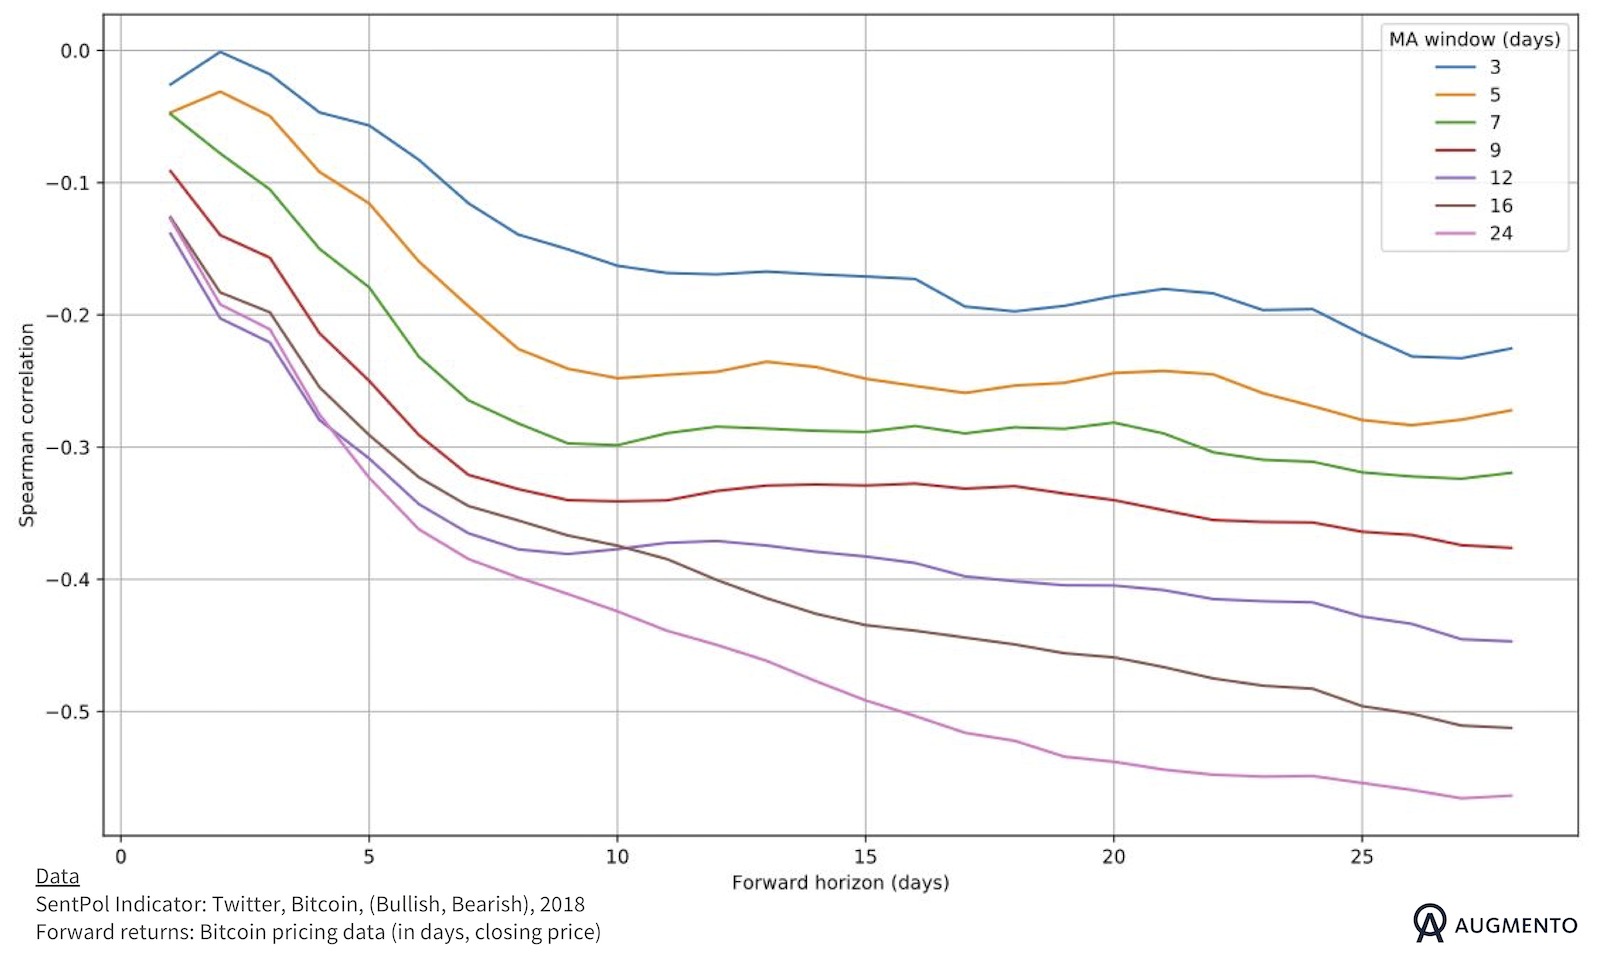
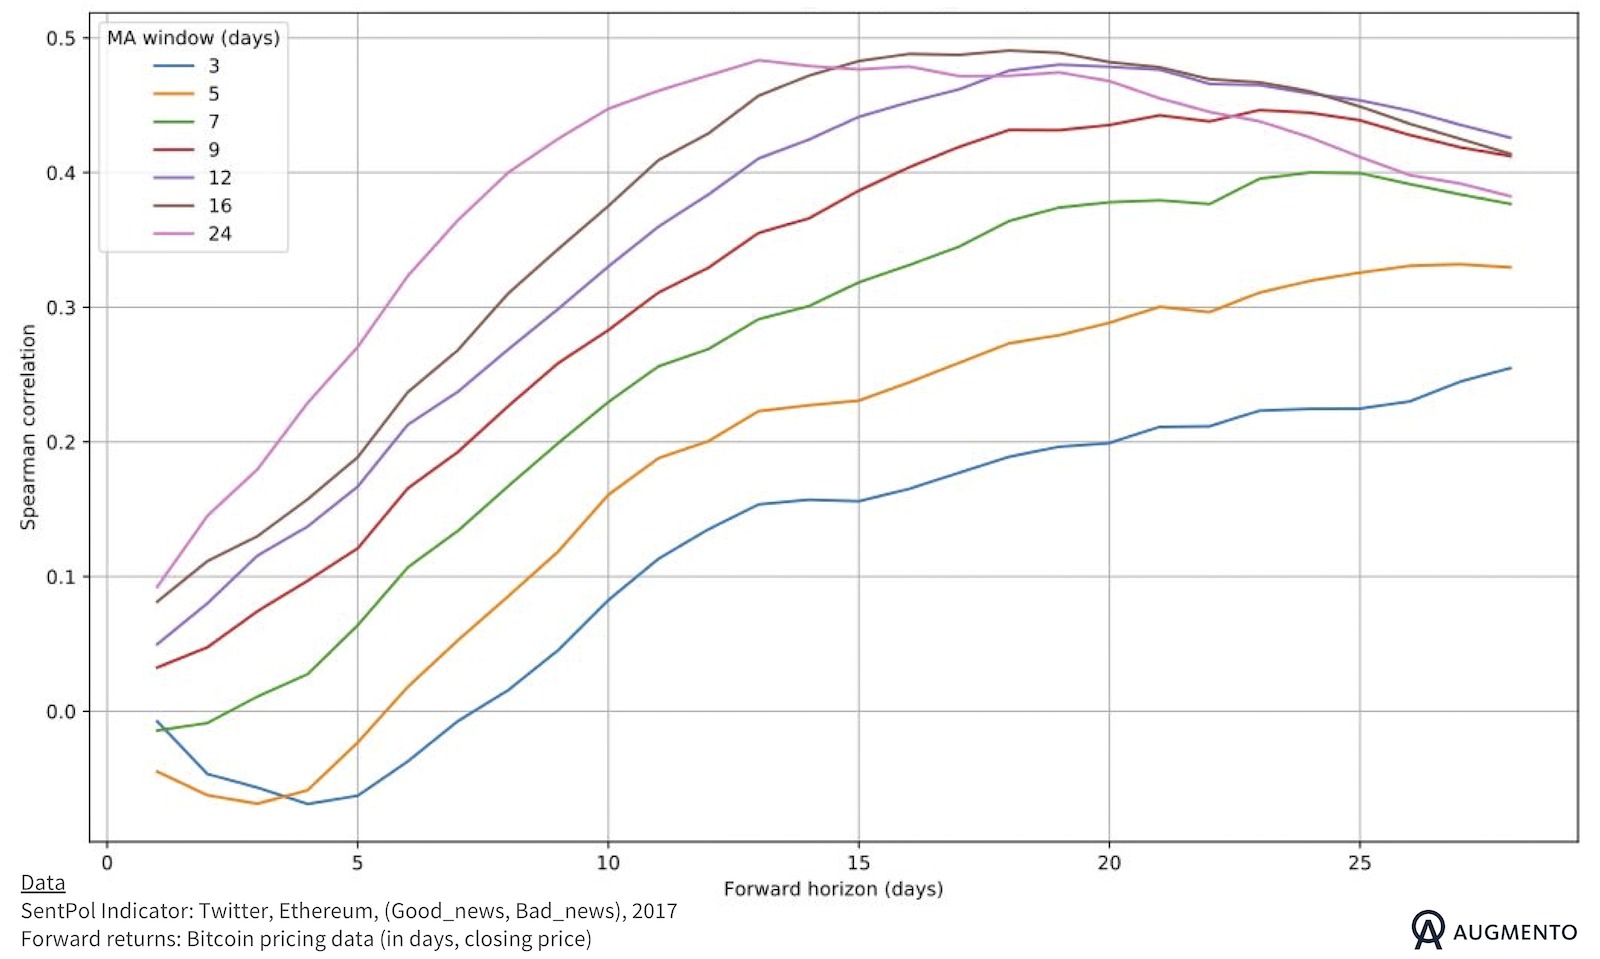
- Resulting indicators exhibit correlations of up to 0.5 (Spearman) with forward returns
- Used sentiments, market cycles and time windows for correlations affect strength of the correlations
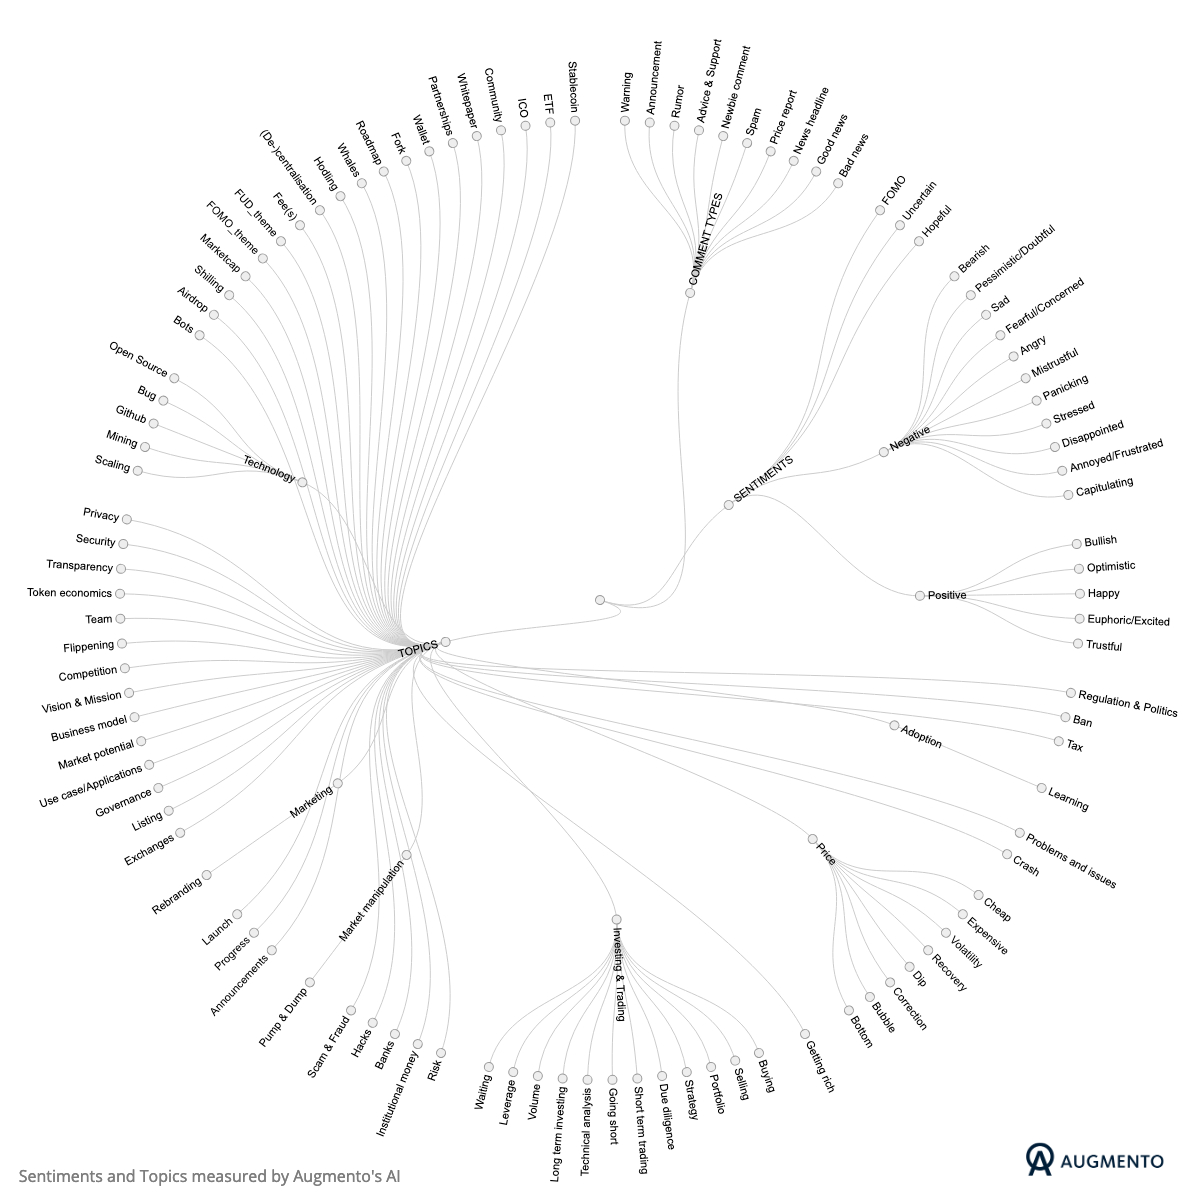
At Augmento we quantify more than 100 sentiments and topics in discussions about cryptocurrencies on social media—Twitter, Bitcontalk and Reddit—in real time.
Some of these sentiments are polar opposites:
- Positive vs. Negative
- Good news vs. Bad news (= mentions of good or bad news affecting crypto currencies)
- Bullish vs. Bearish
The SentPol Indicators are built upon SMAs of selected sentiments from Augmento’s AI.
Strength and direction of the relationship between the indicators and forward returns of the selected cryptocurrencies depend on multiple parameters, including forward horizon (f) of the return and size of the MA window (w) used in the simple moving averages. The SentPol Indicators are calculated as follows:
Where S+/– are opposing sentiments, ΔS+/- denotes the change of S+/- since the previous day, and SMA is the simple moving average with window w. The following formula is used to calculate forward returns of price P at time t, for f days forward:
The correlations between SentPol and forward returns of certain crypto assets reach up to 0.5 (Spearman)[1]. Our findings indicate that synthesizing indicators based on different combinations of Augmento sentiments/topics can be leveraged in different trading contexts.
Short term vs. long term
Some configurations of the SentPol indicator first experience a sharp rise of correlation with forward returns followed by long tails of declining correlation.
Other configurations initially lay flat and then gain significant relevance on a longer time horizon.
Sometimes: counterintuitive logic
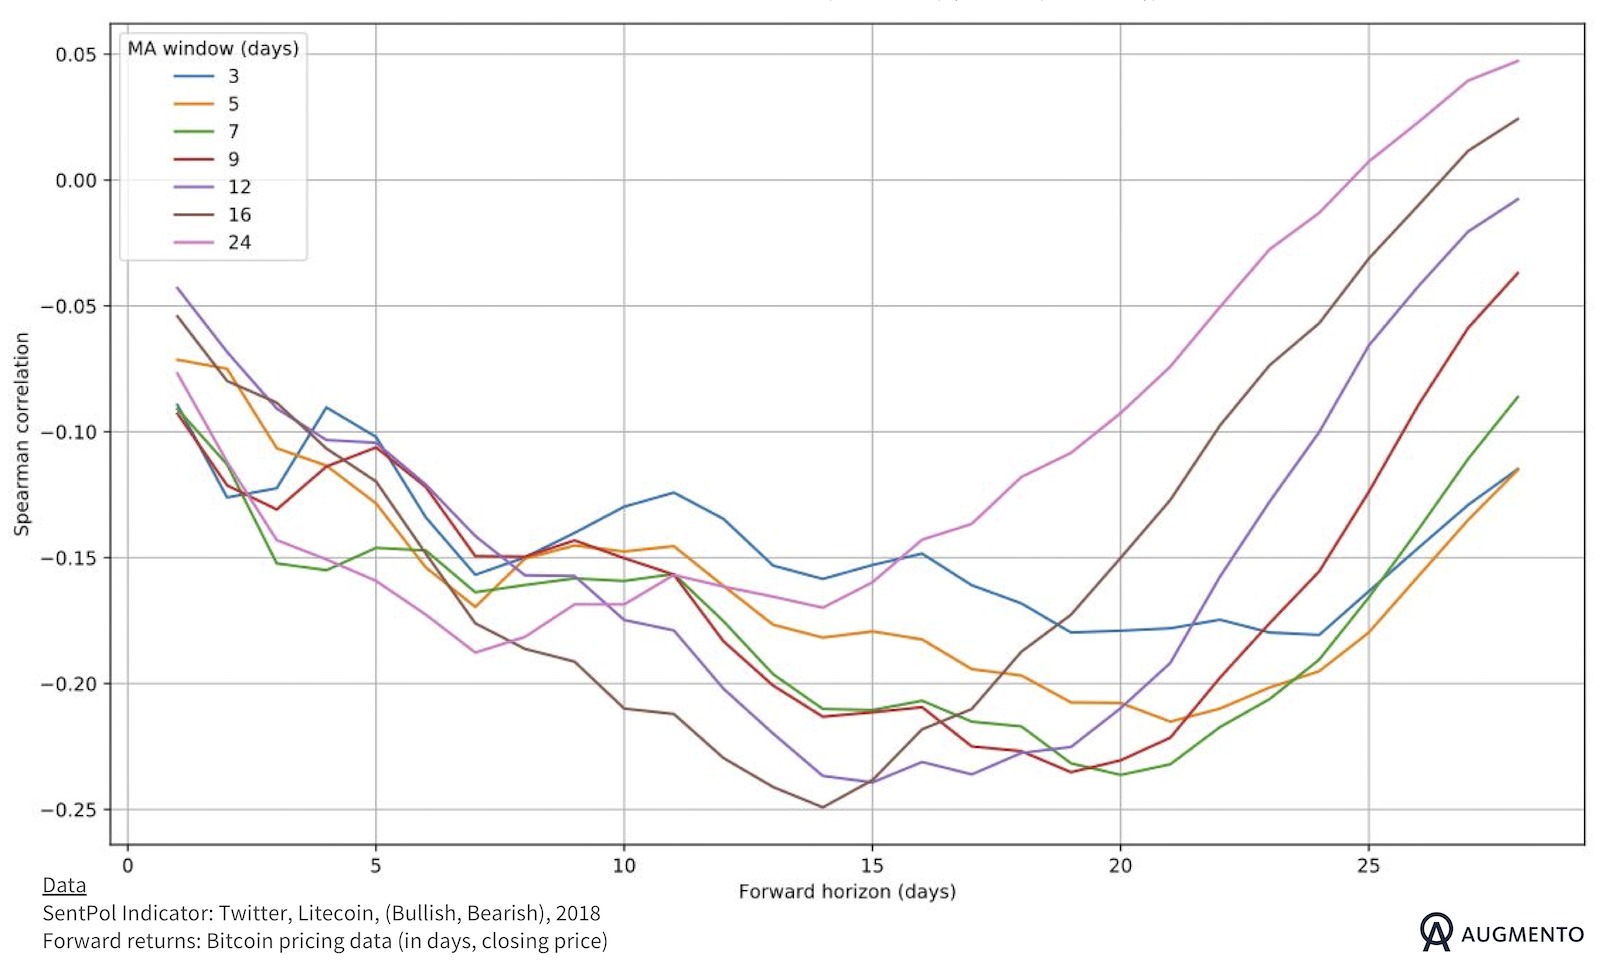
Some sentiment indicators follow an—at first sight—counterintuitive logic. For example, indicators based on bullish and bearish sentiment often start in an area around zero to then develop a strong negative correlation with forward returns temporarily (Fig.3 and Fig.4)—a finding which could be harnessed for counter trading strategies.
Market cycles matter
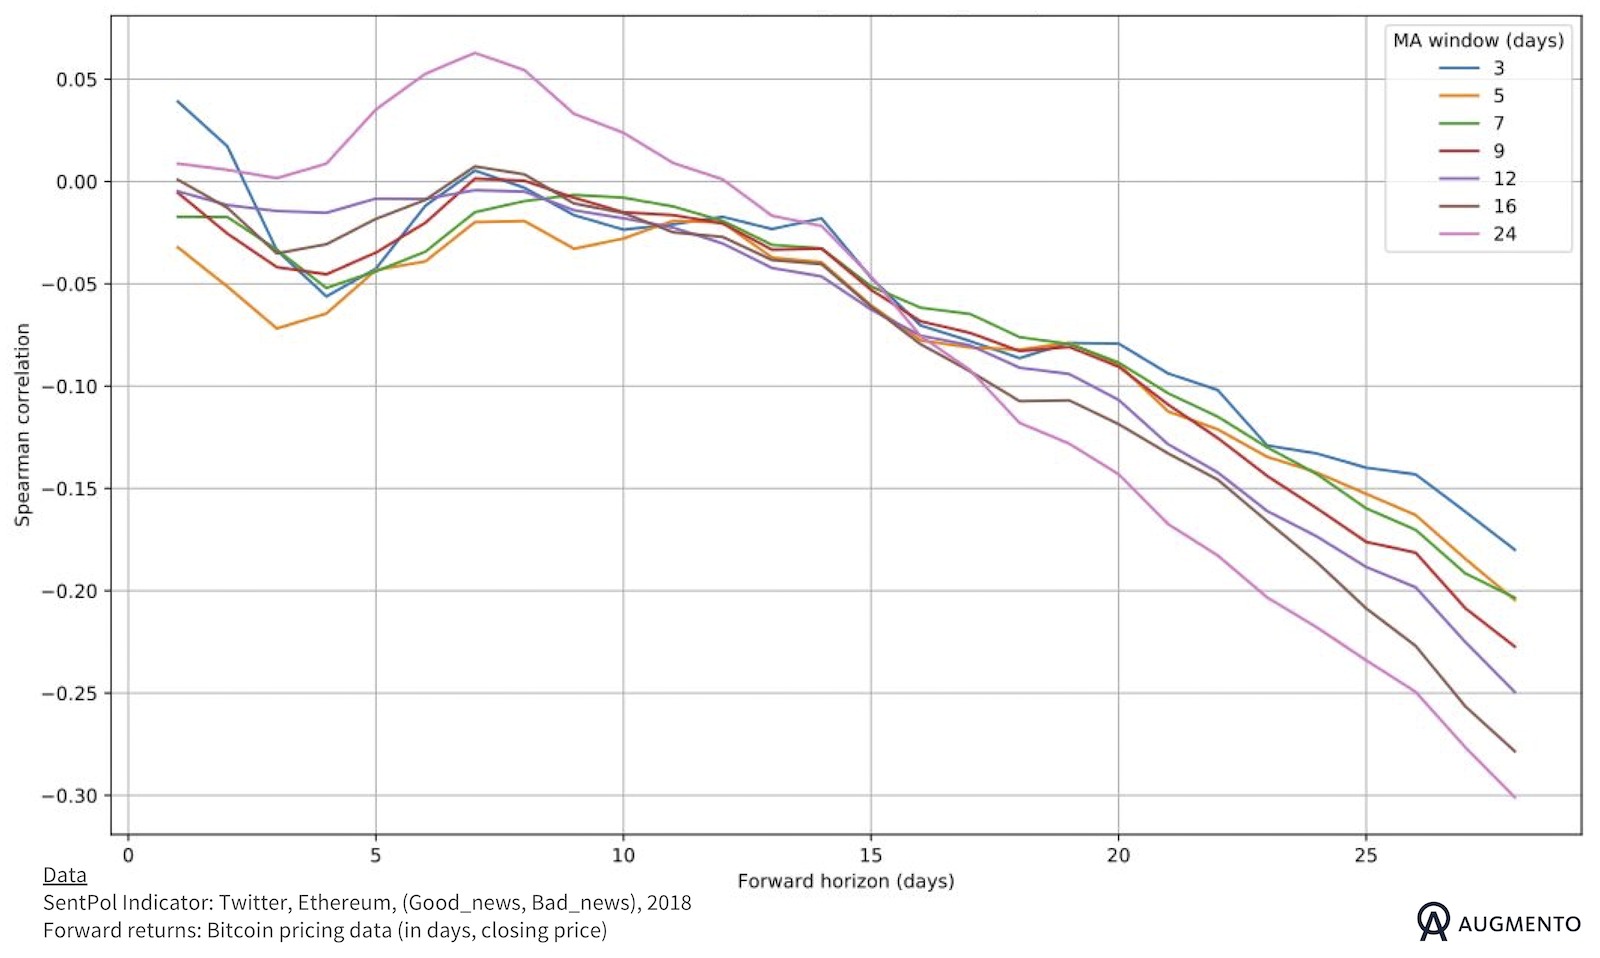
Finally, the findings indicate that sentiments/topics need to be interpreted in relation to the associated market cycle. For example, an indicator based on discussions around Good news and Bad news for Ethereum were positively correlated in a bull market, while exposing an opposite trend in the bear market of 2018 (Fig. 5 and Fig. 6).
Statistical relevance
P-values are dependent on selected MA-timeframes, underlying sentiments and horizon of forward returns. We deem the results as statistically significant with most p-values being extremely small (such as: coin = ripple, datasource = twitter, sentiments = Positive/Negative, forward return horizon = 12 days, MA window = 7 days with a p-value of 1.048335 e-12) while some p-values are bigger but still close to zero (such as: coin = ethereum, datasource = twitter, sentiments = Positive/Negative, forward return horizon = 14 days, MA window = 16 days with a p-value of 0.000188).
Sample size of the evaluated data is 730 (number of days of 2017-2018).
Caveats and further work
The correlations above show that there is a strong signal in the data and that using combinations of sentiments and topics may pay off. However, the correlations often gain relevance after a couple of days which can have implications for live trading strategies, for example in times of high volatility. Any additional work should also include analysis with higher frequency data.
[1] DeFusco, Richard A. (2007). ‘Tests Concerning Correlation: The Spearman Rank Correlation Coefficient’, in Quantitative Investment Analysis. Hoboken, NJ: Wiley


